
I've seen restaurants spend $380,000 on a buildout for a 2,400 sq ft space. They put in 92 seats. Beautiful design. Exposed brick. Custom lighting. They opened and did $48,000 in their first month. The problem: at 92 seats turning 1.8 times a night at a $38 average check, their maximum theoretical revenue was $47,000 a month. They were at capacity on day one. They couldn't grow. They'd built a restaurant that couldn't make money.
The architect designed a beautiful space. The architect did not design a profitable space. Those are different things.
Restaurant floor plans are math problems disguised as design problems. Every square foot costs you rent. Every seat generates revenue. The ratio between them determines whether your restaurant makes money or loses it. Get the floor plan wrong and you're capped at a revenue level that can't cover your costs. Get it right and the same square footage generates 30-40% more revenue.
I've analyzed floor plans for 6 restaurant openings. If you're in the early stages of opening, our how to open a restaurant guide covers the full process from concept to opening day. And before you commit to a space, read our restaurant location selection guide, because the wrong location makes even the best floor plan irrelevant. Here's the math that matters.
Industry Data & Sources:
Bureau of Labor Statistics data shows the restaurant industry employs over 12.5 million people with annual turnover rates around 75%.
The National Restaurant Association provides operational benchmarks and best practices for restaurant management.
The Short Answer
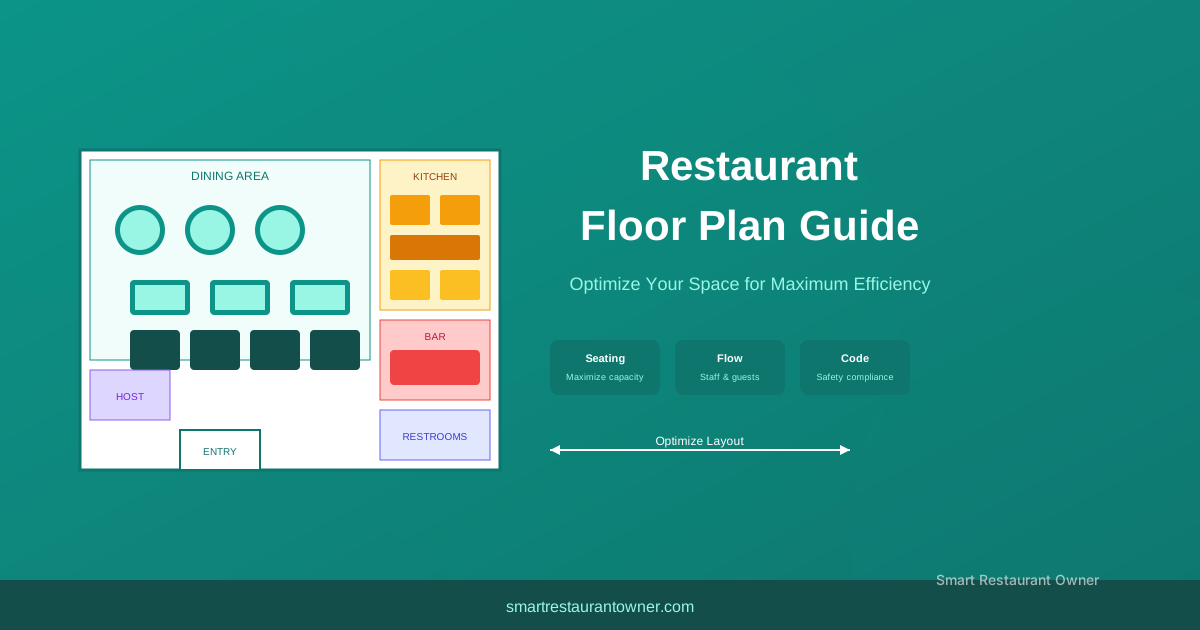
For a full-service restaurant, target 15-18 sq ft per seat in the dining room. A 1,500 sq ft dining room seats 83-100 people. Total space including kitchen, restrooms, and storage should be 60-70% dining room, 30-40% back of house.
For a fast-casual restaurant, target 12-15 sq ft per seat. Counter service means tighter seating. A 1,200 sq ft dining room seats 80-100 people.
For fine dining, target 18-22 sq ft per seat. Larger tables. More space between tables. A 1,500 sq ft dining room seats 68-83 people.
Revenue per square foot should be $300-$600/year for full-service, $400-$800 for fast-casual, $500-$1,000 for fine dining. If you're below these numbers, your floor plan is the problem or your pricing is the problem.
Seating Density by Restaurant Type
| Concept | Sq Ft Per Seat | Avg Check | Typical Turn Rate | Revenue Per Sq Ft (Annual) | Dining Room % of Total Space |
|---|---|---|---|---|---|
| Full-Service Restaurant | 15-18 | $32-$45 | 1.5-2.0x | $300-$600 | 60-65% |
| Fast-Casual | 12-15 | $12-$18 | 2.5-3.5x | $400-$800 | 65-70% |
| Fine Dining | 18-22 | $65-$120 | 1.0-1.5x | $500-$1,000 | 55-60% |
| Bar / Lounge | 8-10 (bar seats) | $15-$40 | 2.0-3.0x | $600-$1,300 | 50-55% |
According to the National Restaurant Association's 2026 State of the Industry report, the average full-service restaurant generates about $385 per square foot annually. The top quartile generates over $550. The difference is almost always seating efficiency and turn rate, not check average. Building industry standards from the International Building Code (IBC) set minimum aisle widths at 36 inches for main paths and 18 inches between fixed seating, which constrains how tightly you can pack tables regardless of your ambition.
The Revenue Per Square Foot Math
Recommended Tool
Track your inventory in real-time and reduce food waste with MarketMan.
Used by 2,400+ restaurants to optimize their purchasing.
Revenue per square foot is the single most important metric in restaurant real estate. It tells you whether your space is earning its rent.
A 2,000 sq ft restaurant paying $6,000/month in rent ($72,000/year) has a rent cost of $36/sq ft/year. If the restaurant does $800,000 in annual revenue, revenue per square foot is $400. Rent is 9% of revenue. That's healthy.
The same 2,000 sq ft restaurant doing $500,000 in revenue has revenue per square foot of $250. Rent is 14.4% of revenue. That's too high. The restaurant is paying for space it's not monetizing.
The fix isn't always "get more seats." Sometimes it's "get higher revenue per seat." A restaurant with 80 seats doing $800,000 has revenue per seat of $10,000/year. A restaurant with 80 seats doing $500,000 has revenue per seat of $6,250/year. Same number of seats. Different revenue because of different check averages and turn rates.
Revenue per square foot = (average check x covers per day x operating days per year) / total square footage.
If your average check is $42, you do 120 covers a day, and you're open 340 days a year, your annual revenue is $1,713,600. In a 2,500 sq ft space, that's $685/sq ft. Excellent.
If your average check is $28, you do 80 covers a day, and you're open 310 days a year, your annual revenue is $694,400. In the same 2,500 sq ft space, that's $278/sq ft. Below average.
The floor plan affects both covers per day (through seating capacity and turn time) and average check (through ambiance and table mix). A cramped restaurant turns tables faster but has a lower check average. A spacious restaurant has a higher check average but turns tables slower. The optimal floor plan balances both.
Dining Room to Total Space Ratio
Your restaurant is not just a dining room. The back of house (kitchen, prep, storage, dishwashing, office) takes 30-40% of your total square footage. Restrooms take 5-8%. Hallways and circulation take 5-10%.
A 2,500 sq ft restaurant typically breaks down as:
- Dining room: 1,500-1,750 sq ft (60-70%)
- Kitchen and prep: 500-625 sq ft (20-25%)
- Storage: 125-200 sq ft (5-8%)
- Restrooms: 125-200 sq ft (5-8%)
- Office: 50-100 sq ft (2-4%)
- Circulation: 125-250 sq ft (5-10%)
If your dining room is less than 60% of total space, you're paying for back-of-house space that doesn't generate revenue. If your kitchen is less than 20%, your kitchen is undersized for your seating capacity and you'll have ticket time problems.
The ratio matters most when you're evaluating a space. A 2,500 sq ft space with a weird L-shape might only fit 1,200 sq ft of dining room. A 2,200 sq ft rectangle might fit 1,500 sq ft of dining room. The smaller rectangle generates more revenue because it has more dining room per total square foot.
Table Mix: The Revenue Optimization Tool
Your table mix (the distribution of 2-tops, 4-tops, 6-tops, and large parties) determines your revenue per square foot more than any other design decision.
2-tops (24" x 30" tables). Seat 2 people. Occupy about 25 sq ft including circulation space. Revenue per square foot is high because 2-tops turn fast. A couple eating dinner stays 60-75 minutes. A 4-top stays 90-105 minutes. The 2-top generates more covers per square foot per hour.
4-tops (30" x 48" tables). Seat 4 people. Occupy about 45 sq ft including circulation. The workhorse of restaurant seating. Most parties are 2-4 people. 4-tops can seat 2, 3, or 4. They're flexible.
6-tops (30" x 60" tables). Seat 6 people. Occupy about 60 sq ft. Lower revenue per square foot because large parties stay longer (105-135 minutes) and per-person spending is similar to smaller parties. But 6-tops are necessary for groups. If you can't seat a party of 6, they go somewhere else.
Banquette seating. Bench seating along a wall. More space-efficient than freestanding tables because you eliminate the circulation space on one side. A banquette with 4 tables seats 8-16 people in the space that would normally seat 6-12. Banquettes also create a more intimate feel and are preferred by many diners.
Bar seating. The highest revenue per square foot in the restaurant. A bar seat occupies about 8-10 sq ft. The customer stays 45-60 minutes. They spend $25-$40 on drinks and maybe food. Revenue per square foot per hour at the bar is 2-3x the dining room.
📬 Get More Customers. Get More Profit.
Join 2,400+ restaurant owners getting actionable tips every Friday. One email. One insight. No spam.
The ideal table mix for a full-service restaurant:
- 2-tops: 25-30% of seats
- 4-tops: 45-55% of seats
- 6-tops: 15-20% of seats
- Bar seats: 10-15% of total seats (counted separately from dining room)
This mix handles the natural distribution of party sizes (most parties are 2-4 people) while maintaining flexibility for larger groups.
Aisle Width and Circulation
The space between tables matters for both guest comfort and server efficiency. Too narrow and guests feel cramped. Too wide and you're wasting revenue-generating space.
Main aisles: 36-48 inches. This is the primary path through the dining room. Servers carrying trays need 36 inches minimum. Two people passing each other need 42-48 inches.
Between tables: 18-24 inches. This is the space between the back of one chair and the back of the next. 18 inches is tight but functional. 24 inches is comfortable. More than 24 inches is wasted space.
Server stations: One server station per 40-50 seats. A server station is a small counter or cabinet where servers store silverware, napkins, water pitchers, and condiments. It should be located so no server walks more than 30 feet to reach it. If servers are walking 60 feet to get water, you're losing 15-20 seconds per trip. At 200 trips a night, that's 50-67 minutes of wasted server time.
The kitchen path: The distance from the kitchen door to the farthest table should be under 60 feet. Beyond 60 feet, food cools down and server trips take too long. If your space forces a longer path, add a service station or pass-through halfway.
The Bar: Your Highest-ROI Square Footage
A bar generates more revenue per square foot than any other part of the restaurant. A 200 sq ft bar with 15 seats can generate $3,000-$5,000 a week in revenue. That's $780-$1,300 per square foot per year. The dining room generates $300-$600.
The bar should be visible from the entrance. It should be the first thing guests see. This isn't about aesthetics. It's about psychology. A bar with people at it signals that the restaurant is popular and worth waiting for. An empty bar signals the opposite.
Bar dimensions: 24-30 inches deep for the bar top. 18-24 inches of bar length per seat. A 20-foot bar seats 10-13 people. The space behind the bar (the bartender's working area) should be 36-42 inches wide. The back bar (liquor display and storage) should be 18-24 inches deep.
If you have a waiting area, put it near the bar. Waiting guests buy drinks. A guest who waits 20 minutes at the bar and buys a $14 cocktail just added $14 to your revenue that you wouldn't have gotten if they waited in the lobby.
Outdoor Seating: The Seasonal Multiplier
Outdoor seating is the highest-ROI square footage in your restaurant because you're not paying rent on it. You're paying for the sidewalk or patio space through a permit ($200-$1,000/year in most cities), not through your lease.
A 300 sq ft patio with 20 seats can generate $150,000-$250,000 in seasonal revenue (6-8 months depending on climate). The incremental cost is furniture ($3,000-$8,000), heaters ($1,000-$3,000), and umbrellas or awnings ($2,000-$5,000). First-year ROI is typically 500-1,000%.
The catch: outdoor seating only works if your climate supports it and your city allows it. Some cities have restrictive sidewalk dining ordinances. Some require specific barriers or railings. Some limit the number of seats. Check before you sign a lease.
Common Floor Plan Mistakes
Too many large tables. A restaurant with mostly 6-tops and 8-tops looks empty on weeknights when parties are 2-3 people. The large tables sit half-empty. Revenue per square foot drops. Use 4-tops as your default and push them together for large parties.
Not enough 2-tops. Couples are your most reliable customer segment. They dine out more frequently than families or groups. They spend more per person. They turn tables faster. If you don't have enough 2-tops, you're turning away your best customers.
The dead zone. Every restaurant has a dead zone. The table next to the restroom door. The table next to the server station. The table in the traffic path to the kitchen. Identify your dead zones and either eliminate them or accept that those tables will have lower utilization.
No flexibility. Fixed banquettes and built-in seating look great but can't be reconfigured. A restaurant with all fixed seating can't adjust its table mix as customer patterns change. Use a mix of fixed and movable seating. Keep at least 30% of your tables movable.
Ignoring the wait station. Servers spend 20-30% of their time walking to and from the kitchen and wait station. If the wait station is poorly located, that percentage goes up. Every percentage point is labor cost you're paying for walking instead of serving.
FAQ
How many seats can I fit in my space?
Dining room square footage divided by 15-18 for full-service. A 1,500 sq ft dining room fits 83-100 seats. This includes tables, chairs, aisles, and server stations. It does not include the bar, which is calculated separately at 8-10 sq ft per seat.
What's a good revenue per square foot?
$400-$600/year for full-service. $500-$800 for fast-casual. $600-$1,000 for fine dining. Below $300 and you're either in a low-rent market or your concept isn't working.
Should I hire an architect or a restaurant designer?
Restaurant designer. Architects understand buildings. Restaurant designers understand revenue per square foot. Hire someone who's designed restaurants before. Ask to see their previous projects and the revenue numbers those projects achieved.
How do I calculate my maximum theoretical revenue?
Seats x turns per day x average check x operating days per year. 100 seats x 1.8 turns x $42 check x 340 days = $2,570,400. If your rent is more than 10% of this number, the space is too expensive. If your projected revenue is below 70% of this number, your concept or location is the problem. To model your specific break-even point based on your rent and projected covers, use our break-even calculator.
Next step: A great floor plan only matters if the rest of your restaurant is set up to succeed. Read our complete guide to opening a restaurant for the full checklist, from business plan to grand opening.
Recommended Tool
Streamline your inventory management with MarketMan.
Get real-time tracking, automated ordering, and waste reduction.